Algorithm
VALIS (Vote Allocating Immune System) is a supervised learning algorithm inspired by the immune system. Classification is performed by a population of local rules (antibodies) that can bind to the data samples (antigens). In case of multiple bound antibodies, classification result (immune response) is determined through a vote allocation process with each antibody voting with its class distribution.
Training is performed in a generational manner, with each generation consisting of selection, reproduction and replacement steps. Reproduction is performed by means of crossover and mutation operators. During the replacement step, a fraction of the antibodies with low values of the fitness function is replaced by the newly created offsprings. An antibody's fitness is determined by its accuracy and a sharing factor. The latter is introduced to simulate the competition for limited resources. As soon as a large number of antibodies starts to accumulate in the same area, their sharing factors drop. This mechanism forces the system to explore other regions and to cover the training data more uniformly.
Overall, the training process resembles a genetic algorithm with niching. However, unlike the genetic algorithm, the ultimate goal of VALIS is creating a population that acts as a whole and solves the problem cooperatively. The training is driven entirely by self-organization. A coherent global behaviour emerges from purely local antibody-antigen interactions.
Experiments
Early version of the system was tested on a character recognition problem. The training data consisted of randomly scaled (x0.9 .. x1.1) and rotated (±15°) numerals from 0 to 9. Classification accuracy of 99% was achieved with 300 antibodies. The system can be considered to be a kind of distributed memory. Classification is performed collectively, so there is a significant degree of robustness to antibody deletion. After 80% of the antibodies were deleted at random, classification accuracy dropped only slightly to 96%.
In another experiment, the system was trained to distinguish between 6 different programming languages given a piece of source code. 96% classification accuracy was achieved. Examples of antibodies corresponding to different languages:
| Assembler | @, mov, lf |
| Basic | $ |
| C | fp, {#13, }, <, \n |
| Fortran | #10c |
| Lisp | ;;, ), ))#13 |
| Pascal | en, in#13, := |
A recent revision of the algorithm was tested on 6 benchmark problems and compared to a number of algorithms implemented in the scikit-learn package. VALIS performed on par with or better than many well-established algorithms, including k nearest neighbours (kNN), logistic regression (LR), linear and quadratic discriminant analysis (LDA, QDA), naive Bayes (NB), AdaBoost (AB), decision trees (CART), random forests (RF) and support vector machines (SVM). Overall, it ranked first by both the geometric mean and the minimum of normalized accuracies.
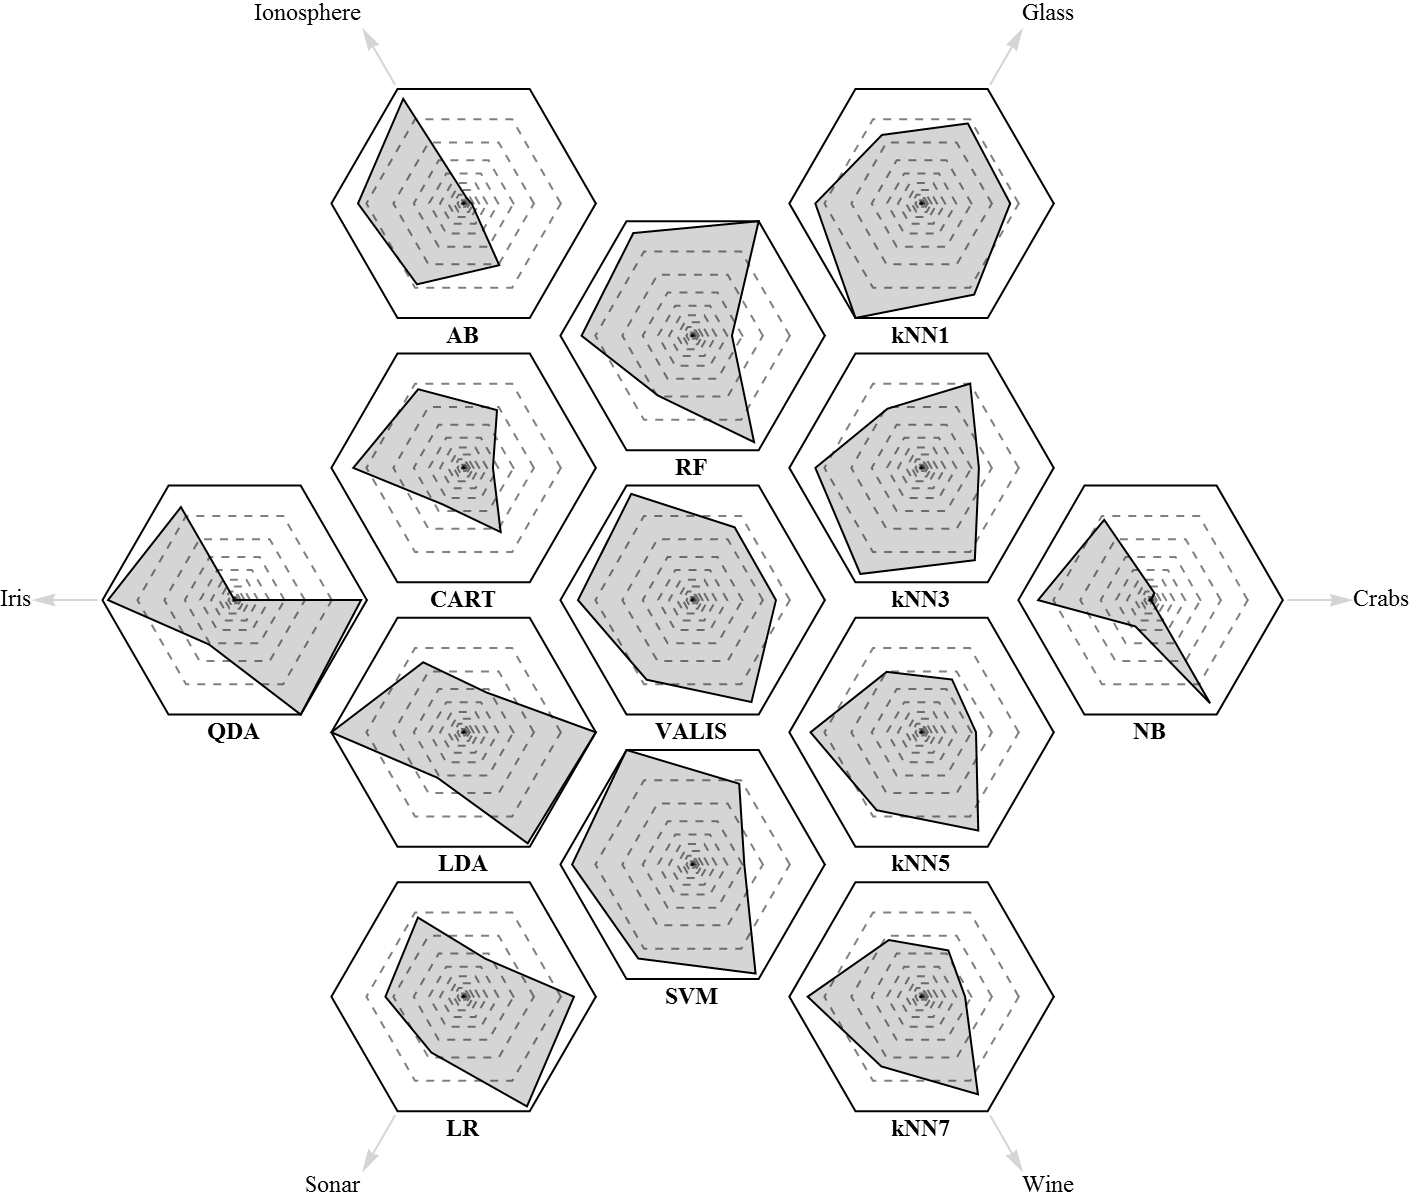
Radar plots of relative performance. Dashed lines correspond to 5% increments.
| GM | Min | |
|---|---|---|
| VALIS | 0.956 | 0.926 |
| SVM | 0.956 | 0.855 |
| kNN (k = 1) | 0.953 | 0.918 |
| RF | 0.940 | 0.817 |
| kNN (k = 3) | 0.938 | 0.870 |
| LDA | 0.933 | 0.838 |
| LR | 0.922 | 0.832 |
| kNN (k = 5) | 0.920 | 0.863 |
| kNN (k = 7) | 0.907 | 0.831 |
| CART | 0.883 | 0.778 |
| AB | 0.820 | 0.600 |
| NB | 0.747 | 0.394 |
| QDA | 0.722 | 0.174 |
Visualization
Another notable feature of VALIS is the ability to visualize the state of the population during the training. A rendering of the population can be obtained by slicing it with a plane. Alternatively, antibody centers and the input data can be projected onto a plane and the bindings can be depicted by lines. The plane can be defined by a pair of the original variables or by the data's principal components. The visualization provides a unique insight into the algorithm's behaviour.
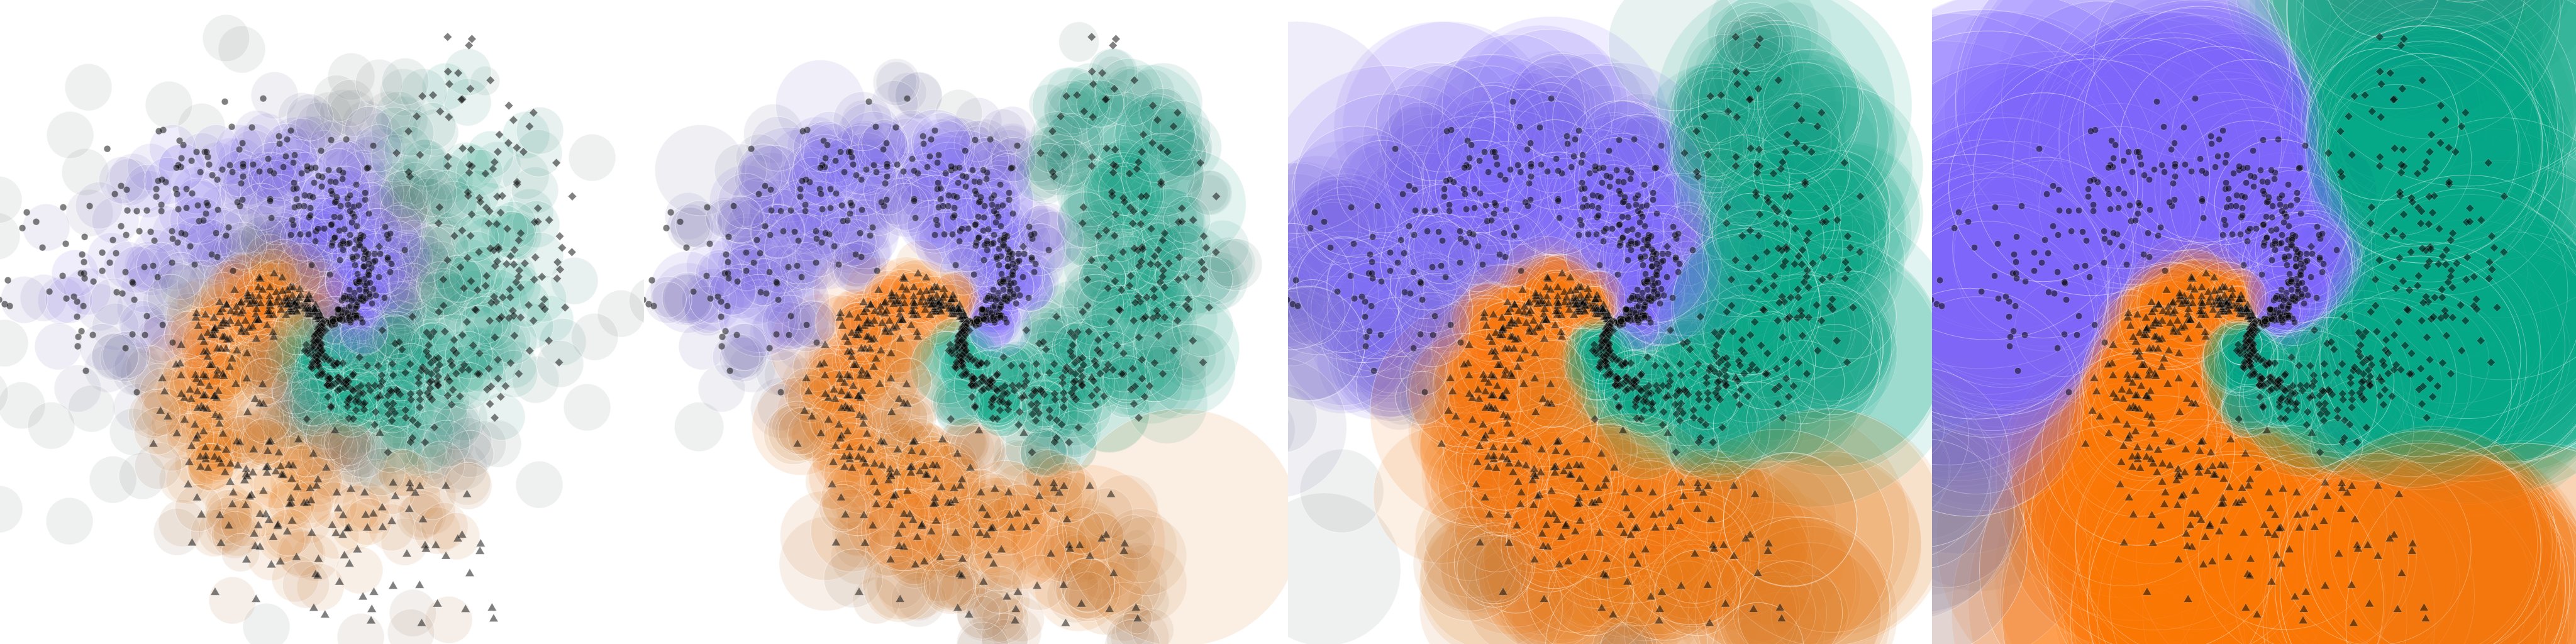
Visualization of training on a synthetic 2D problem at generations 1, 67, 200, 600. Training data are marked in black, with class indicated by shape. Antibodies are shown as circles with colors determined by their class distributions. Learning rate was held constant.
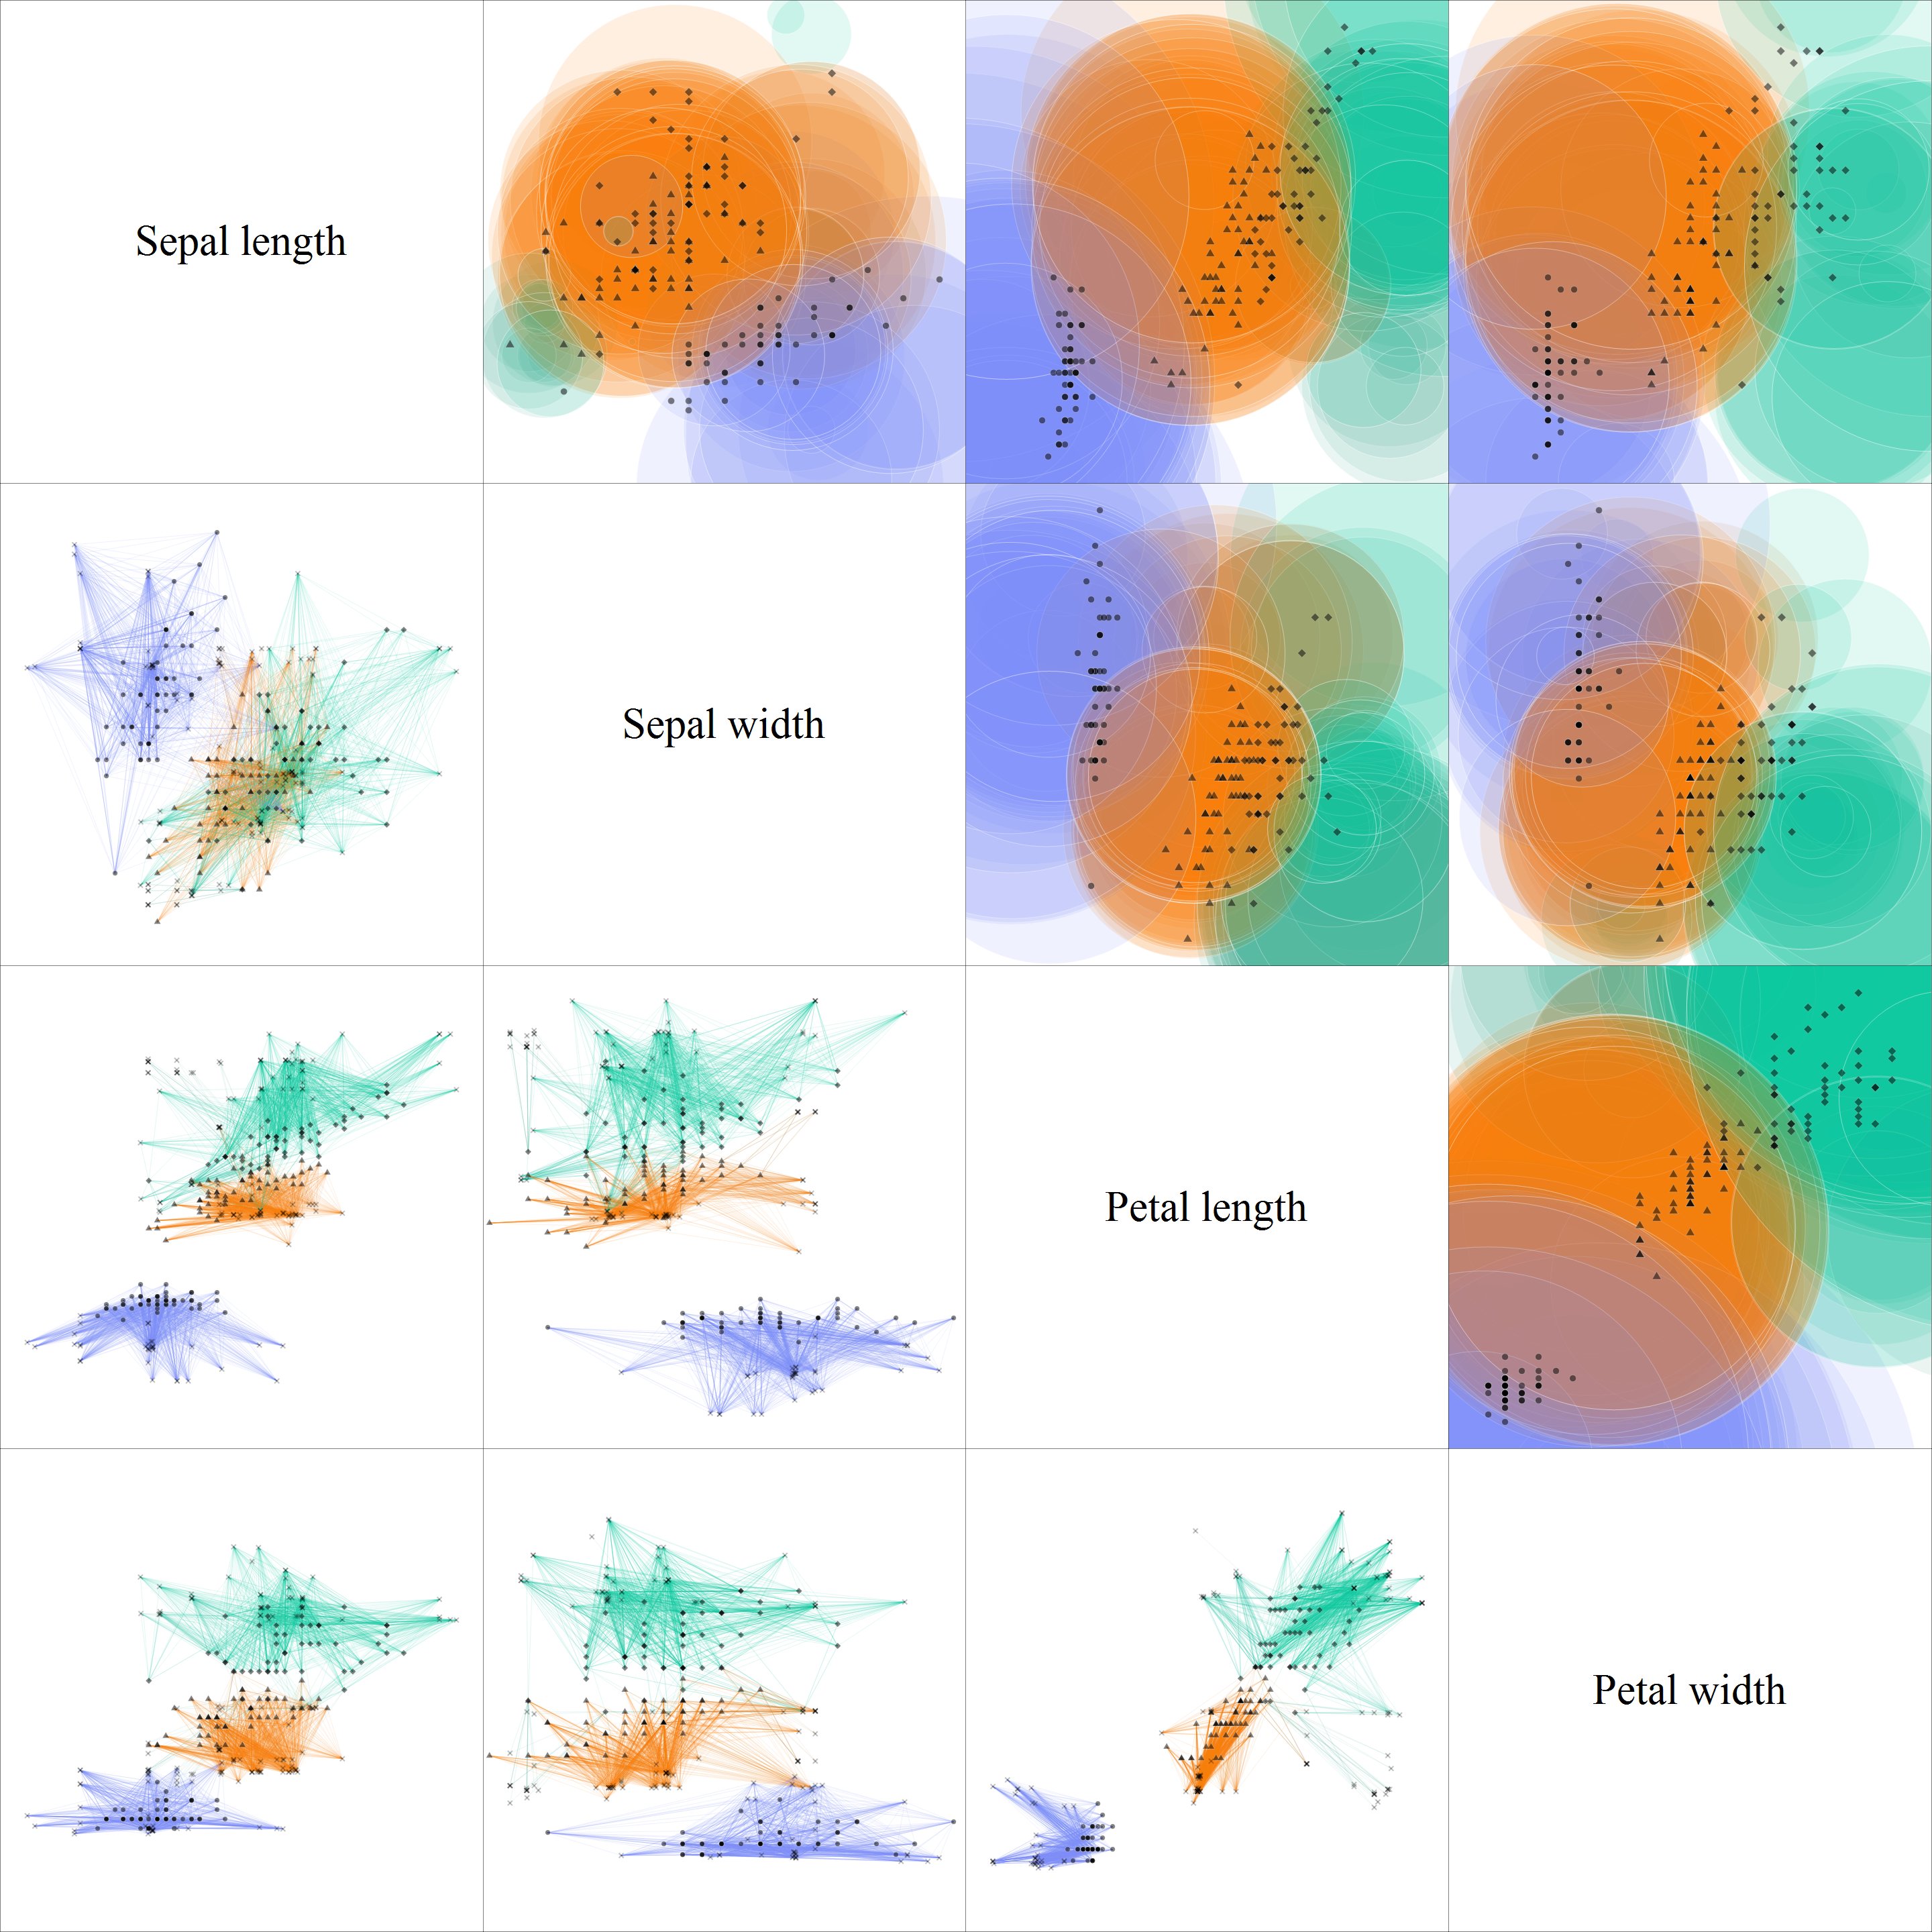
Visualization of the final antibody population on Iris dataset. Upper triangle depicts population cross-sections, lower triangle - antigen bindings. Colors are determined by antibody class distributions.
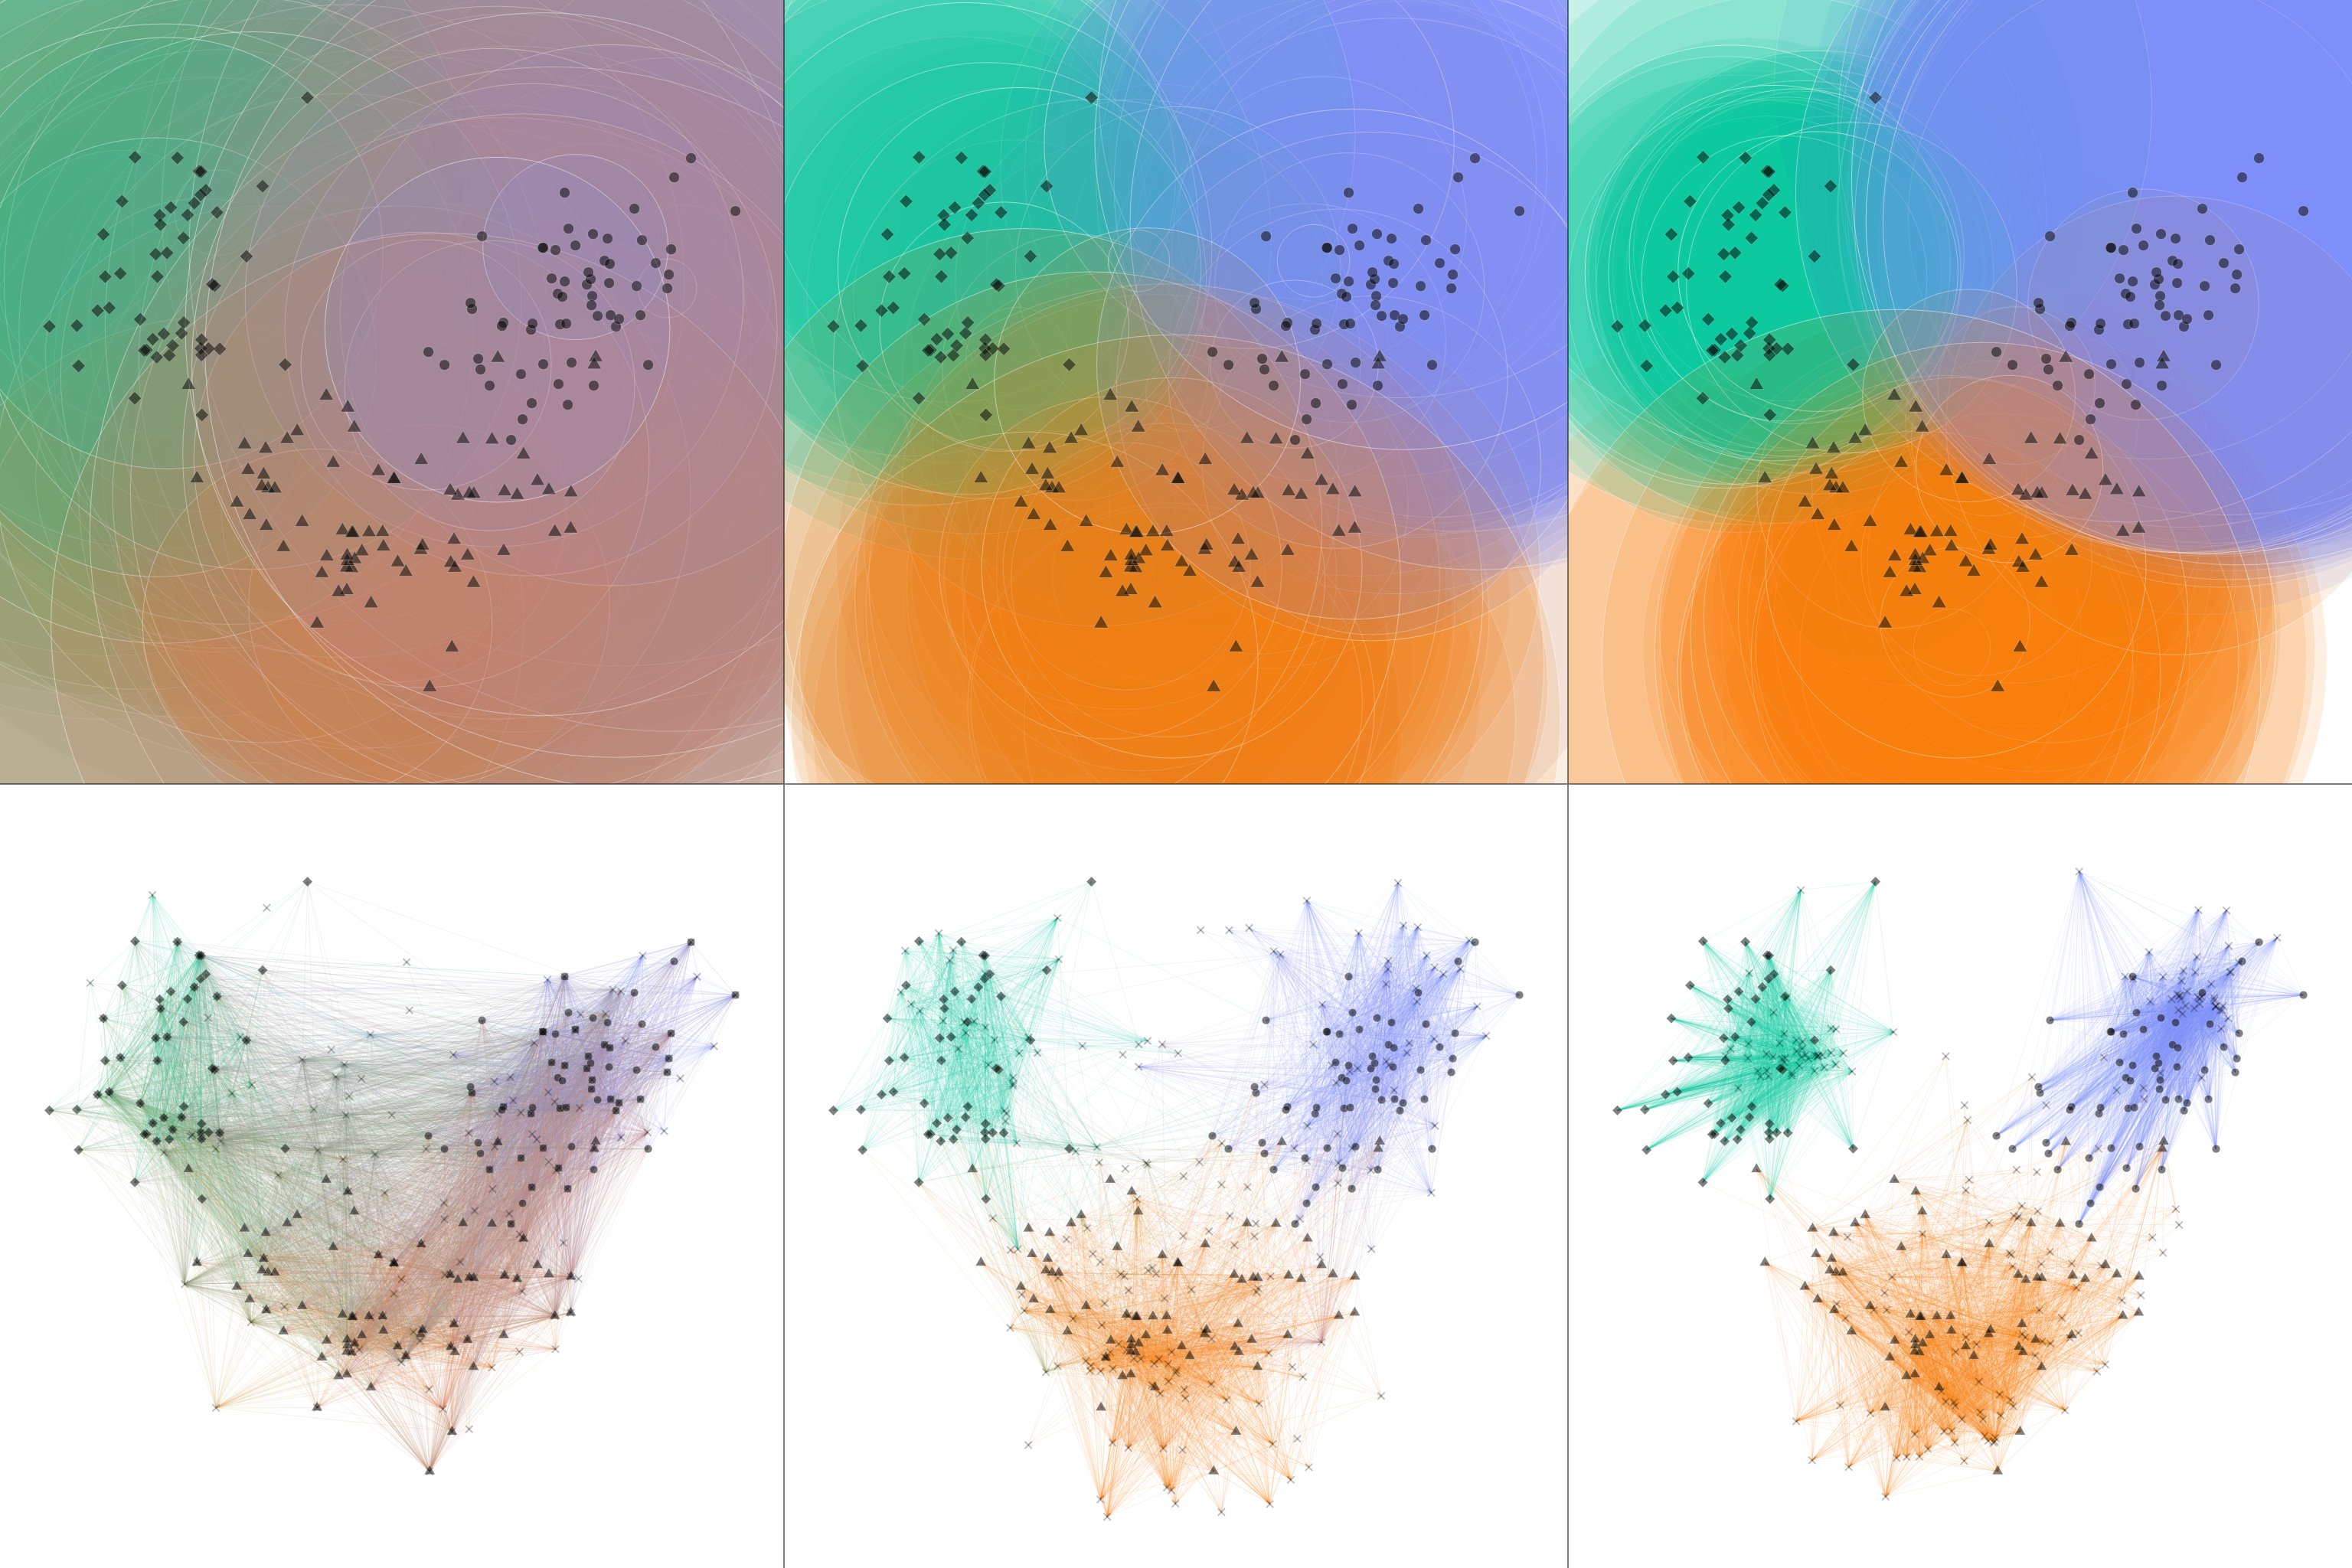
PCA-based visualization of the population at the beginning, middle and end of the training on Wine dataset. Upper half depicts principal plane cross-sections, lower - antigen bindings.
Source code
The latest version of VALIS is hosted on Github.
Publications
Карпов П. М. Новый иммуноподобный алгоритм классификации типа "обучение с учителем" VALIS / VALIS, a novel immune-inspired classification algorithm // XII национальная конференция по искусственному интеллекту с международным участием КИИ-2010 (20-24 сентября 2010 г., Тверь, Россия): Труды конференции. В 4-т., М: Физматлит, 2010, Т.2, с.325-334. PDF (Russian), presentation: English / Russian
Karpov P., Tonda, A., Squillero, G. VALIS: an Evolutionary Classification Algorithm. 2017. Draft PDF