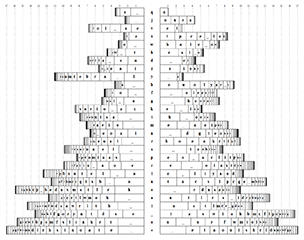
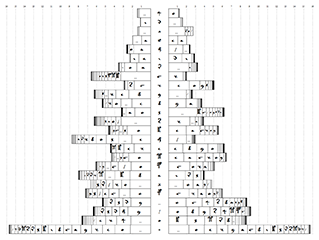
Define the conditional right / left distribution of a character as the distribution of characters immediately following / preceding it. These distributions carry important information about a language and can, for example, be used to separate vowels from consonants. However, when represented simply as frequency tables they aren't very illustrative, so I decided to make a visualization.
A single conditional distribution p is visualized in the following way. First, calculate Shannon's diversity index d1(p) = Exp(-∑pi Ln pi), which measures how many different values a distribution can effectively take. As you may recognize, it is an exponentiated entropy. Diversity index of a uniform distribution over n values is n.
Then draw a bar with unit height and length = d1(p), subdivide it into sections with lengths proportional to pi and sort the sections by length. The length of each section can be interpreted as the ratio of the corresponding conditional character probability to the weighted geometric mean of pi with weights pi. The complete visualization is a stack of left pL and right pR conditional distribution bars sorted by total diversity index d1(pL) × d1(pR).
Now let's take a look at the visualizations of English (statistics collected from Moby-Dick) and Voynich manuscript. '_' denotes spaces, '/' new lines, and '*' marks the unconditional distributions.


Some interesting, even if well-known features of Voynichese are apparent:
- It is predictable in the sense of having relatively low conditional distribution entropies. In English, the bigram entropy is 7.41 bits and the unigram entropy is 4.09 bits, the ratio being 1.81. For Voynichese, the corresponding figure is 6.04 / 3.88 = 1.56.
- EVA q is followed by o 97.5% of the time, and n is preceded by i 97.4% of the time. Could these combinations actually be single characters?
- m, g, n and y appear mostly at the ends of the words.
- Beginnings and ends of lines influence the character statistics. m and g appear especially frequently at line ends, while the line beginnings have an increased proportion of p and t (it has been suggested that gallows can serve as paragraph markings).
- Similar-looking gallows (k and t, f and p) have very similar statistics, but p and t appear much more frequently at the line beginnings. A similar phenomenon occurs with r and m, but m usually ends the line. Could the symbols with extra loops (p, t and m) be a special newline graphic variants of f, k and r?
